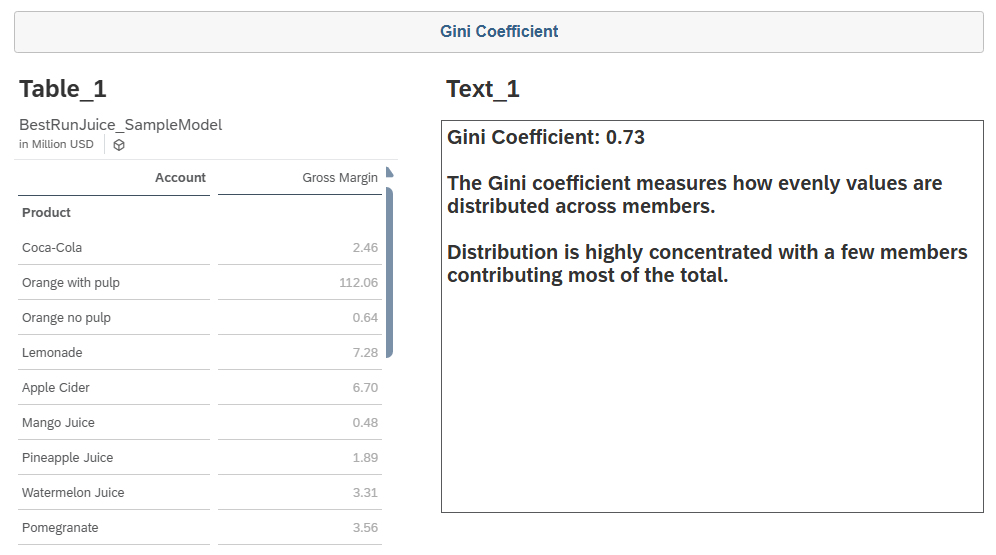
This article explains how to calculate the Gini Coefficient in SAP Analytics Cloud using table ResultSet scripting.
The script retrieves measure values from a table, sorts them, and applies the Gini formula to determine how evenly performance is distributed across dimension members.
The result provides a powerful statistical indicator of value concentration or inequality that can be displayed dynamically in a story text widget.
// Get result set
var resultSet = Table_1.getDataSource().getResultSet();

if (resultSet.length > 0)
{
    var count = resultSet.length;

    var values = ArrayUtils.create(Type.number);

    var total = 0.0;

    // ----------------------------
    // Collect values
    // ----------------------------
    for (var i = 0; i < count; i++)
    {
        var value = ConvertUtils.stringToNumber(resultSet[i][Alias.MeasureDimension].rawValue);

        values[i] = value;
        total = total + value;
    }

    // ----------------------------
    // Sort ascending
    // ----------------------------
    for (var a = 0; a < values.length; a++)
    {
        for (var b = 0; b < values.length - 1; b++)
        {
            if (values[b] > values[b + 1])
            {
                var temp = values[b];
                values[b] = values[b + 1];
                values[b + 1] = temp;
            }
        }
    }

    // ----------------------------
    // Calculate Gini coefficient
    // ----------------------------
    var weightedSum = 0.0;

    for (var j = 0; j < values.length; j++)
    {
        weightedSum = weightedSum + (j + 1) * values[j];
    }

    var gini = (2 * weightedSum) / (count * total) - (count + 1) / count;

    // Round result
    var giniRounded = Math.round(gini * 1000.0) / 1000.0;

    var giniText = ConvertUtils.numberToString(giniRounded);


    // ----------------------------
    // Interpret the result
    // ----------------------------
    var interpretation = "";

    if (gini < 0.2)
    {
        interpretation = "Values are very evenly distributed across members.";
    }
    else if (gini < 0.4)
    {
        interpretation = "Distribution is relatively balanced with moderate variation.";
    }
    else if (gini < 0.6)
    {
        interpretation = "Values are moderately concentrated among a smaller group of members.";
    }
    else
    {
        interpretation = "Distribution is highly concentrated with a few members contributing most of the total.";
    }

    // ----------------------------
    // Output narrative
    // ----------------------------
    var output =
        "Gini Coefficient: " + giniText +
        "\n\n" +
        "The Gini coefficient measures how evenly values are distributed across members." +
        "\n\n" +
        interpretation;

    Text_1.applyText(output);
}
Code language: JavaScript (javascript)