var Dimension =Chart_1.getDimensions(Feed.CategoryAxis)[0];
var selections = Chart_1.getDataSource().getDataSelections();
for (var i=0;i<selections.length;i++)
{ var member = Chart_1.getDataSource().getResultMember(Dimension,selections[i]);
var DESC = member.description;
var TEXT_VALUE =Text_box1.getPlainText()+'\n'+DESC;
Text_box1.applyText(TEXT_VALUE); }
/ * at each pass of the loop we take the current text in the text box and append with the next dimension description on
a new line */
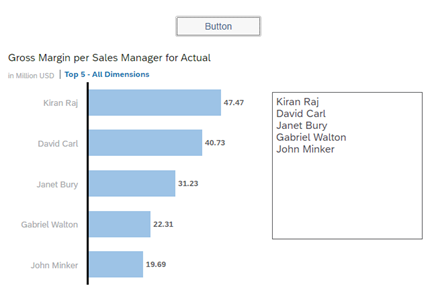
Code language: JavaScript (javascript)Using a chart, button and text box – when you click the button the result should be as per below